

Emerald Pages
◆
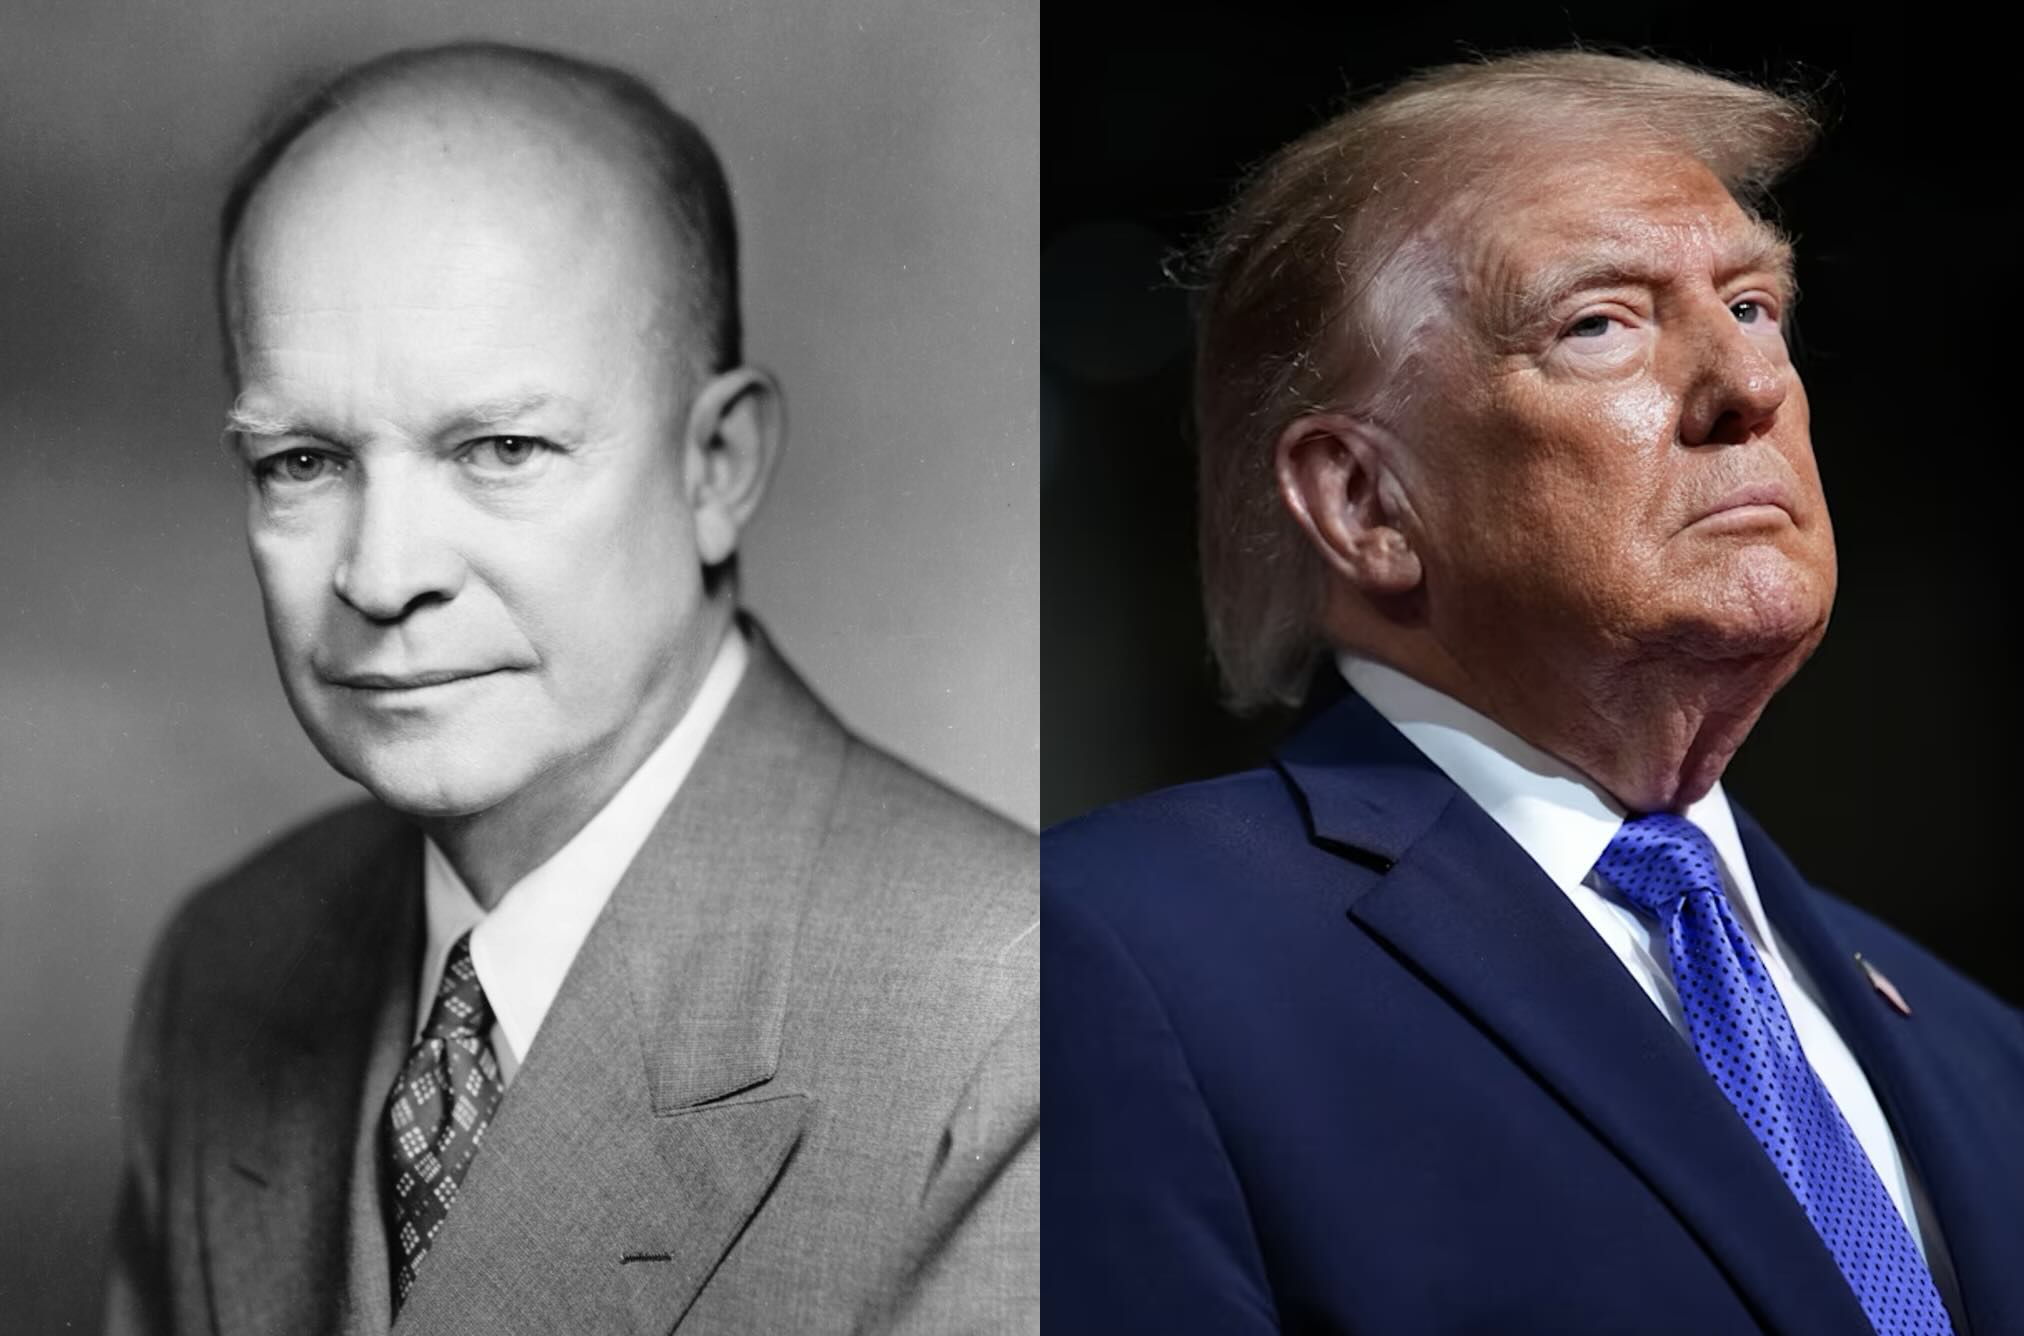
Republican Presidents Dwight Eisenhower (left) and Donald Trump (right) | Photo: Emerald Book Image
When economists at the National Bureau of Economic Research date the start of a recession, they are not measuring how a family feels when it cannot afford rent. They are measuring the direction of aggregate output. Yet the two questions are inseparable in American politics, because the official scoreboard keeps producing a lopsided result: of the eleven recessions between 1953 and 2020, ten began during the terms of Republican presidents. That is not a random distribution. A 10-of-11 pattern over seven decades is statistically implausible as pure chance. The pattern is real, and the evidence points to the design of Republican economic policy as the mechanism that produces it.
The timeline is unambiguous. Dwight Eisenhower presided over three downturns, in 1953, 1957, and 1960, the last of which helped fuel John F. Kennedy's promise to "get the country moving again." Richard Nixon caught the 1969 recession and the stagflationary collapse of 1973 following the OPEC embargo. Ronald Reagan entered office in 1981 into a deep contraction, then presided over a boom whose banking deregulation would fracture later. George H.W. Bush saw a recession begin in July 1990, damaging his re-election. George W. Bush opened his term amid the dot-com bust in March 2001 and closed it inside the Great Recession that began in December 2007. Donald Trump's first term ended in the wake of the February 2020 COVID-19 shutdown. Only Jimmy Carter's 1980 downturn breaks the modern Republican streak.
How Republican Policy Design Produces Downturns
The record is the predictable output of supply-side design. The mechanism has three moving parts, each documented in the historical data. First, financial deregulation removes the circuit breakers that keep a market shock from becoming a systemic crisis; the savings-and-loan collapse of the late 1980s and the subprime mortgage implosion of 2007 both followed periods of relaxed oversight. Second, large tax cuts passed during expansions inject stimulus into an economy that is already hot, creating asset bubbles and forcing the independent Federal Reserve to raise rates aggressively—historically a reliable trigger for downturns. Third, because the gains of these policies concentrate at the top, the consumer base that drives most GDP growth grows fragile, leaving the economy with little cushion when a shock arrives.
The deregulation evidence is the strongest single thread. The Savings and Loan Crisis of the late 1980s followed the early-1980s deregulation that let thrifts invest in speculative real estate; when the bubble burst, hundreds of institutions failed and required a taxpayer bailout, contributing to the 1990 recession. The Great Recession followed the systematic unwinding of New Deal-era banking laws, including parts of Glass-Steagall in 1999, and the lack of oversight on mortgage-backed securities. In both cases, the removal of guardrails allowed risks to build beneath the surface until the system fractured. Deficit-fueled overheating tells a similar story: Republican tax reforms under Reagan, George W. Bush, and Trump expanded deficits during expansions, injecting artificial stimulus into already-growing economies and forcing the Fed to brake hard.
The consumer-fragility mechanism is visible in the wage data. When the gains of growth concentrate at the top—as they did in the late 1980s and mid-2000s—middle- and lower-income wages stagnate while the costs of healthcare, education, and housing climb. A household living paycheck to paycheck cannot absorb a shock, so a modest correction cascades into a broad contraction. The pattern is not about who sits in the Oval Office when the clock strikes midnight on an NBER report; it is about a policy mix that burns hot, hollows out the middle class, accumulates financial risk, and crashes.
The Hollow Defense
Defenders of Republican frameworks attribute the pattern to three things: voters elect Republicans late in expansions, policy lags mean the imbalances built under Democrats, and external shocks cluster by chance. None of these explanations holds up against the record. The "peak choice" claim would require that Republican presidents consistently inherit economies already at their peak—but several entered office during expansions they then presided over until a downturn: Eisenhower in 1953, Nixon in 1969, George W. Bush in 2001. The policy-lag defense would require that the decisive imbalances consistently built under Democrats, yet the S&L crisis followed early-1980s deregulation under Reagan, and the 2008 collapse followed the deregulation and deficit spending of the Bush years. External shocks are real—the 1973 OPEC embargo, the 2020 pandemic—but a shock only becomes a recession when the economy lacks the buffers to absorb it. Fragile consumer demand and hollowed-out financial guardrails are precisely those missing buffers, and they are products of policy, not weather.
- Ten of eleven recessions from 1953 to 2020 began under Republican presidents—a pattern far too consistent to be random.
- Financial deregulation preceded both the S&L crisis and the 2008 collapse; deficit-fueled tax cuts forced the Fed to brake hard.
- GDP growth has averaged roughly 1.8 points higher under Democrats, but GDP measures output, not household affordability.
- The "bad timing" defense fails: Republican terms repeatedly produced the fragility that turned shocks into recessions.
A president can preside over a technically expanding economy while real wages fall behind inflation, housing costs lock out a generation, and the "misery index" stays elevated. The 2026 environment illustrates the gap: headline growth of 3.4% in the third quarter coexisted with inflation at 3.7%, wage growth of 3.1%, mortgage rates at 7.4%, and a federal deficit near $2 trillion. To a household facing those numbers, the official expansion is hollow. The same logic cuts across party lines—the late-1970s inflation under Carter and the 2021–2022 surge under Biden eroded purchasing power just as surely as stagnant mid-2000s wages did under Bush. But the structural pattern of Republican terms—deregulation, concentrated gains, and a fragile consumer base—makes the household squeeze more likely to end in an official contraction.
Republican policies cannot stabilize the cycle because they stimulate the wrong part of the economy: cutting corporate taxes does little when the constraint is household demand, and removing financial guardrails converts manageable corrections into systemic crises. The 2026 record reinforces this: tariff-driven inflation pushed prices up 3.7%, the Fed held rates near two-decade highs, and JPMorgan placed recession odds at 40% while Moody's Analytics tracked 35%. The White House has few direct levers over global oil shocks or a Federal Reserve that raises rates on its own timetable—but the policies it does control consistently remove the buffers that would otherwise absorb those shocks.
The 2026 Test: Tariffs, the AI Bubble, and a Divided Government
Broad tariffs have acted as a consumption tax, pushing inflation to 3.7% and weakening retail sales and consumer confidence. To fight that inflation, the Federal Reserve has held rates near two-decade highs, freezing the housing market with mortgage rates above 7% and cooling corporate hiring. The administration points to 3.4% annualized GDP growth in the third quarter, and 4.1% unemployment, with the UCLA Anderson Forecast and University of Michigan projecting roughly 2% growth through 2028, buoyed by private investment in artificial intelligence infrastructure.
That AI investment is also the largest new risk, and it fits the structural pattern. Tech stocks account for roughly half of total S&P 500 value in late 2026, and over 80% of intellectual property investment and nearly half of recent GDP demand growth are tied to technology and AI hardware. The boom is built on debt: tech and infrastructure companies have borrowed over $460 billion this year for data centers and processing power, and cracks have appeared—Oracle's invocation of "force majeure" to delay debt payments on a major data center, steep valuation cuts at OpenAI, and record purchases of credit default swaps to insure against tech corporate defaults. The administration's deregulation of energy networks and credit structures has embedded these liabilities inside state pensions and insurance backing, so a valuation collapse would lock credit markets and force a taxpayer-backed bailout—the same deregulation-to-crisis mechanism seen in 1990 and 2008.
The trap is monetary. Normally a bursting bubble is met with rate cuts and fiscal stimulus, but with national debt at $40 trillion, annual deficits near $2 trillion, and core inflation stuck at 3.7%, either response risks stagflation. And the 2026 midterms handed both chambers to the Democrats, mapping the blame in advance: critics will call a downturn the predictable finale of Republican policy, while the administration will argue a hostile Congress created the legislative friction and debt-limit uncertainty that spooked markets.
What the record establishes is narrower but harder to dismiss. The pattern is real, the structural mechanisms are documented, and the metric matters. Judged by GDP alone, the partisan gap is partly explainable by luck and timing. Judged by what households actually experience—real disposable income, housing affordability, the cost of groceries and fuel—the case that Republican leadership leaves ordinary Americans worse off is a structural argument, not a statistical curiosity, and no single quarter of growth can settle it.
No Ads. By Us. For Us.
This article was made possible by readers like you. We hope it inspired you to support Emerald Book, so we can continue producing content like this.
We will never show you ads, sell your data, or require a subscription to consume our content. Your gift helps us keep the truth accessible.
Click the Support button to give a gift of any amount today.
Thank you for making this work possible.