

Emerald Pages
◆
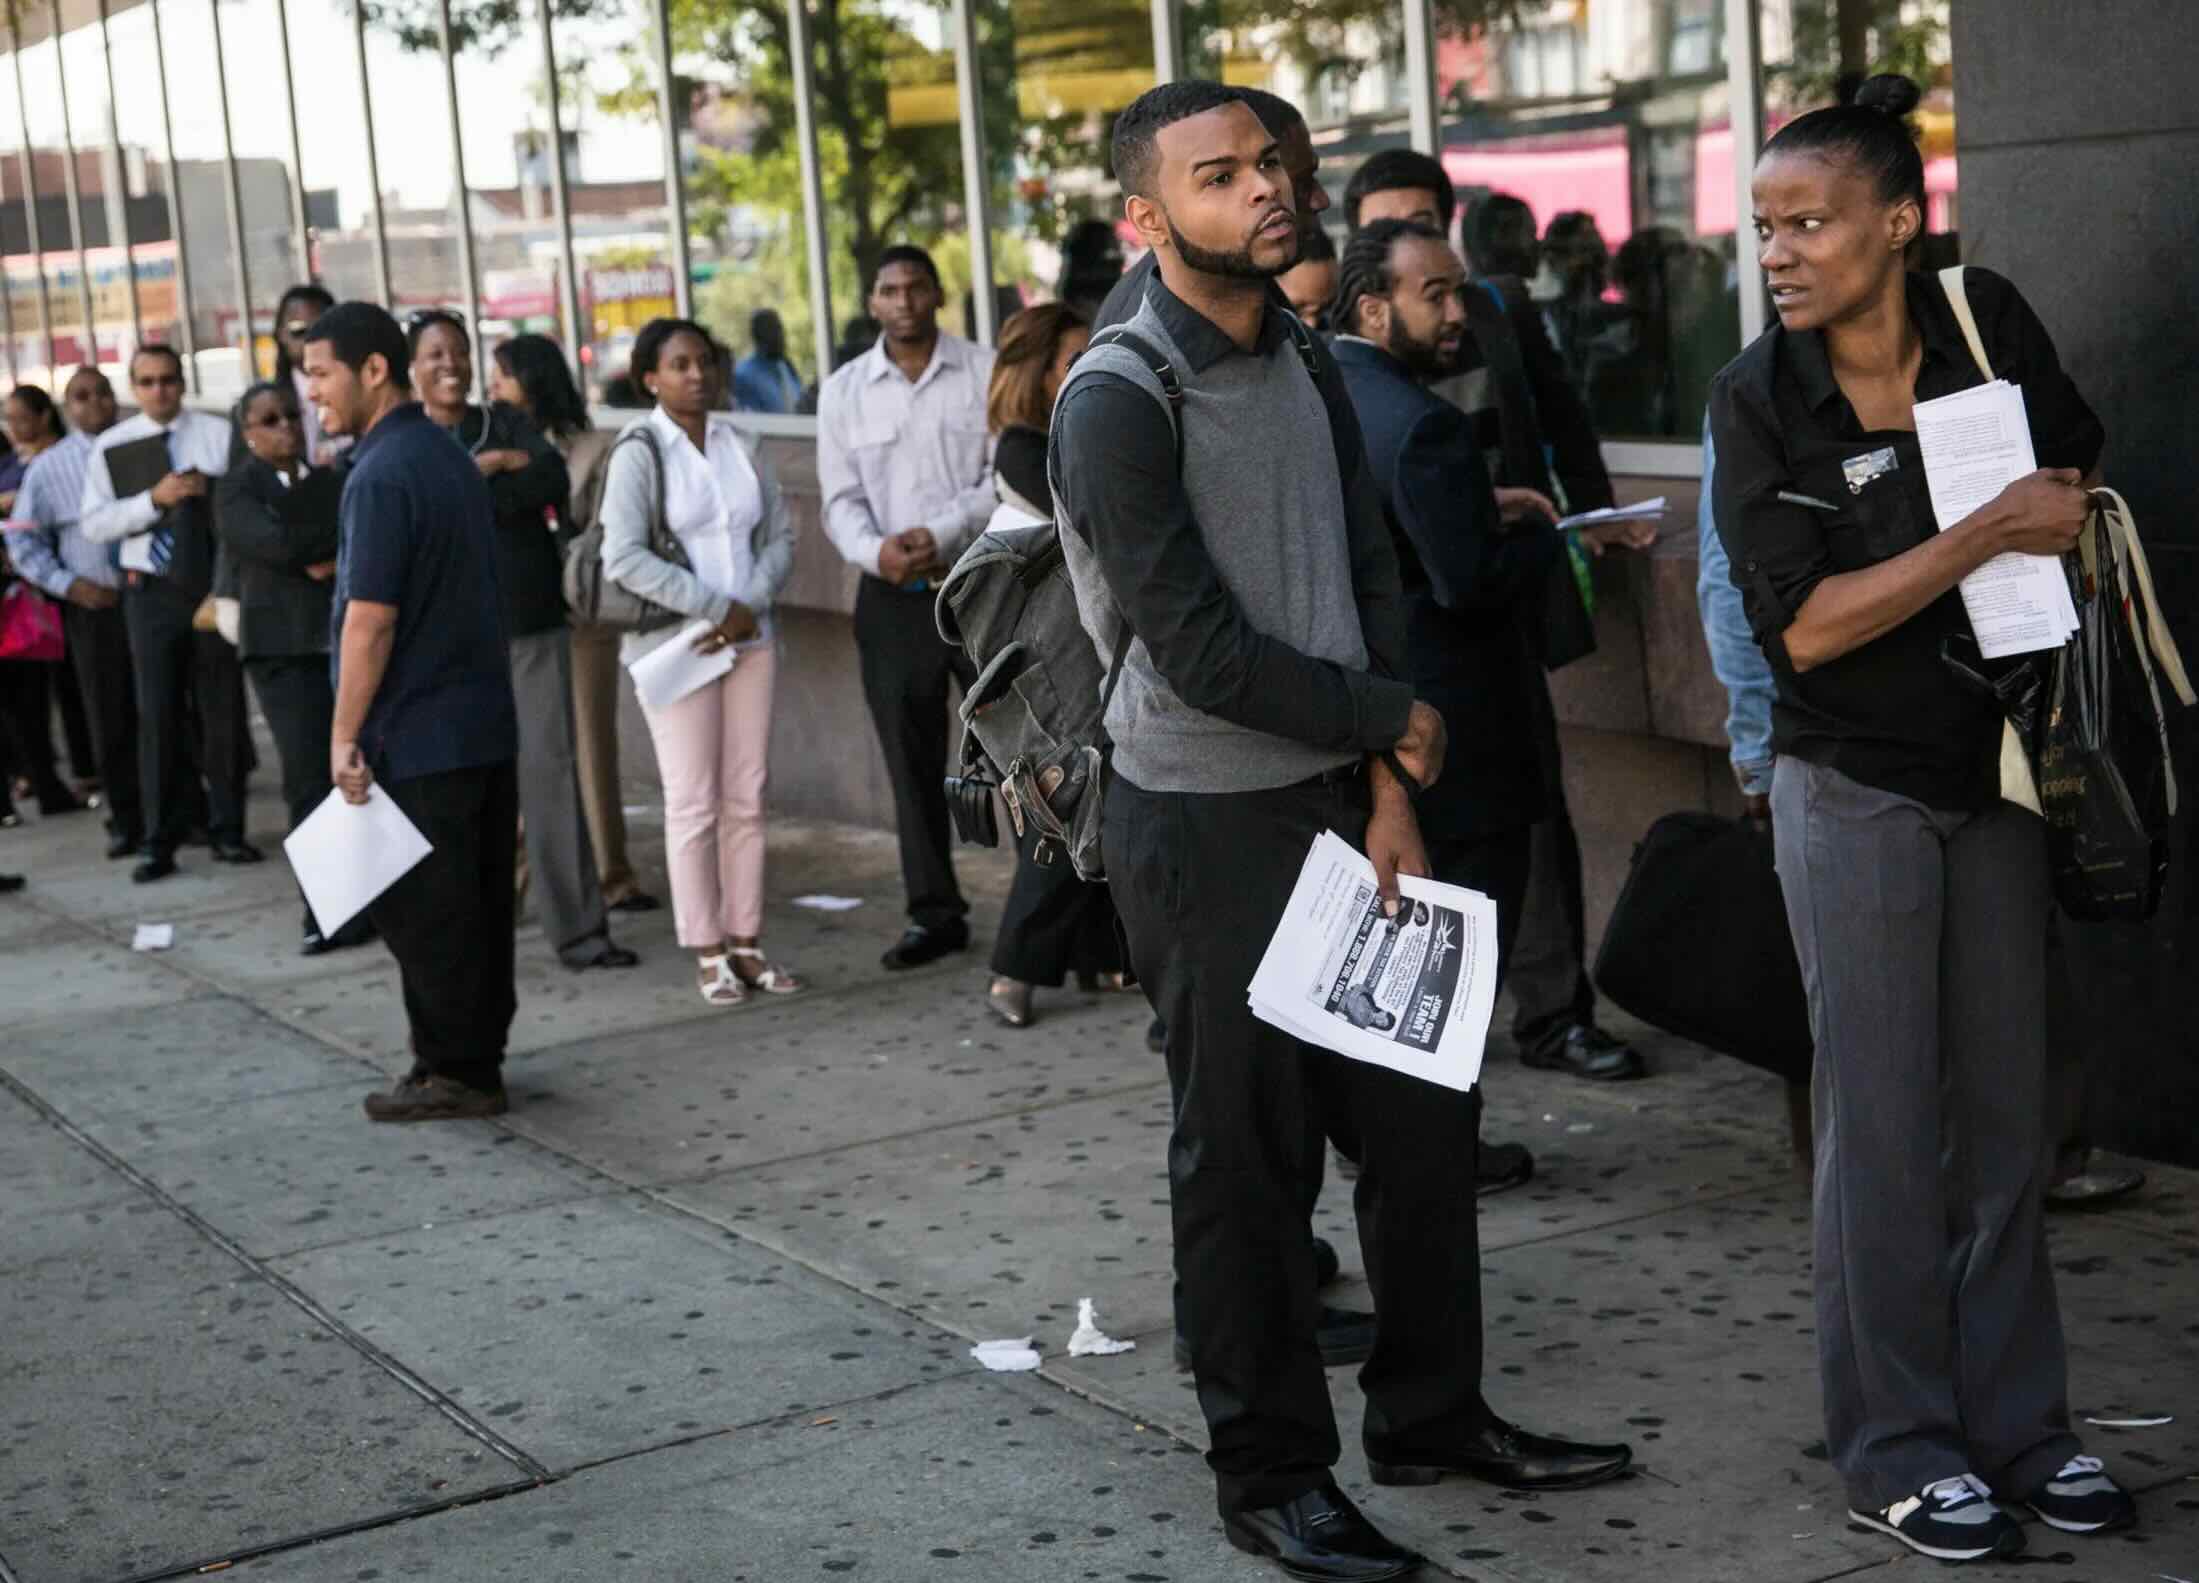
Photo: Andrew Burton | Getty Images
The unemployment rate remains low primarily because the official calculation strictly excludes anyone who is not actively looking for work. If someone is jobless but has stopped applying for roles, they are completely removed from the math. This creates a massive disconnect between a "good" headline percentage and how difficult it actually feels to find a job.
According to the latest data from the U.S. Bureau of Labor Statistics (BLS), the official number of unemployed people is 7.1 million—which gives us the headline 4.2% rate. However, if you add the millions of people who want a job but have stopped applying, plus those trapped in the gig economy, the actual pool of underutilized or struggling workers is far larger.
To understand the true number of people who are out of work, we have to look past the official headline percentage and add up the different groups of invisible workers that the government leaves out. The total number of working-age American adults completely outside the workforce system has surged to a record 105.8 million people.
The Three Tiers of the Actual Jobless Rate
The headline number you see in the news—the U-3 unemployment rate—is legally and mathematically accurate by its official definition, but it is not a complete measure of total joblessness. To see the full picture, economists look at the U-6 rate and other alternative metrics.
- The Broad Government View (U-6): At 7.9%, this rate counts officially unemployed people (7.1M), plus involuntary part-time workers stuck in the gig economy (4.7M), plus discouraged workers who looked for a job within the past year but stopped in the last 4 weeks (1.4M). Total: 13.2 million people.
- The Jobless-But-Want-Work View: By adding the 6.0 million adults who are classified as "Not in the Labor Force" but explicitly tell surveyors they want a job, the real jobless rate rises to 7.5%. Total completely jobless people who want work: 13.1 million people.
- The Non-Living-Wage View (TRU): Private research organizations like the Ludwig Institute for Shared Economic Prosperity (LISEP) calculate a "True Rate of Unemployment" of 24.7%. This tracks the percentage of the labor force that does not have a full-time job, has no job at all, or works a job that fails to pay a functional living wage.
If you combine the 13.1 million completely jobless people who want a position with the 4.7 million people stuck in survival part-time work, there are 17.8 million Americans facing severe employment distress—a number far removed from the rosy 4.2% headline.
The 12-Month "Expiry Date"
Even the broader U-6 rate, which tries to capture discouraged workers, has a built-in time limit. To be counted as a "discouraged worker," you must have looked for a job sometime in the last 12 months. If someone has been completely demoralized by automated hiring loops or corporate freezes and hasn't filled out a single application in over a year, they drop out of the U-6 calculation too. They are officially categorized as "Not in the Labor Force"—indistinguishable in the data from a wealthy retiree or a full-time student.
This is why the "low-hire, low-fire" stasis of the current market is so deceptive. Companies are holding onto their existing staff tightly, keeping first-time unemployment insurance claims low. But they are highly reluctant to add new headcount due to economic uncertainty. This makes it brutally difficult for anyone already out of work to find an open door.
The Bottom Line: What is the True Rate?
The true rate depends on how you choose to define the workforce. There is no single official percentage. However, the data reveals three distinct mathematical rates that capture the workers who are normally ignored by standard headlines.
The discrepancy between these numbers and the official 4.2% rate isn't a conspiracy—it's a methodological choice made during the Great Depression to isolate economic cycle changes. However, this rigid definition severely breaks down during periods of intense hiring burnout or major cultural shifts in work. If you are looking for a job right now and feel like the system is rigged against you, you are not imagining it. The data shows you are part of a much larger, invisible group that the headlines refuse to count.
No Ads. By Us. For Us.
This article was made possible by readers like you. We hope it inspired you to support Emerald Book, so we can continue producing content like this.
We will never show you ads, sell your data, or require a subscription to consume our content. Your gift helps us keep the truth accessible.
Click the Support button to give a gift of any amount today.
Thank you for making this work possible.